

Type:
USAID Digital Frontiers: Building an Interactive Data Visualization Tool to Explore Digital Ecosystem Indicators
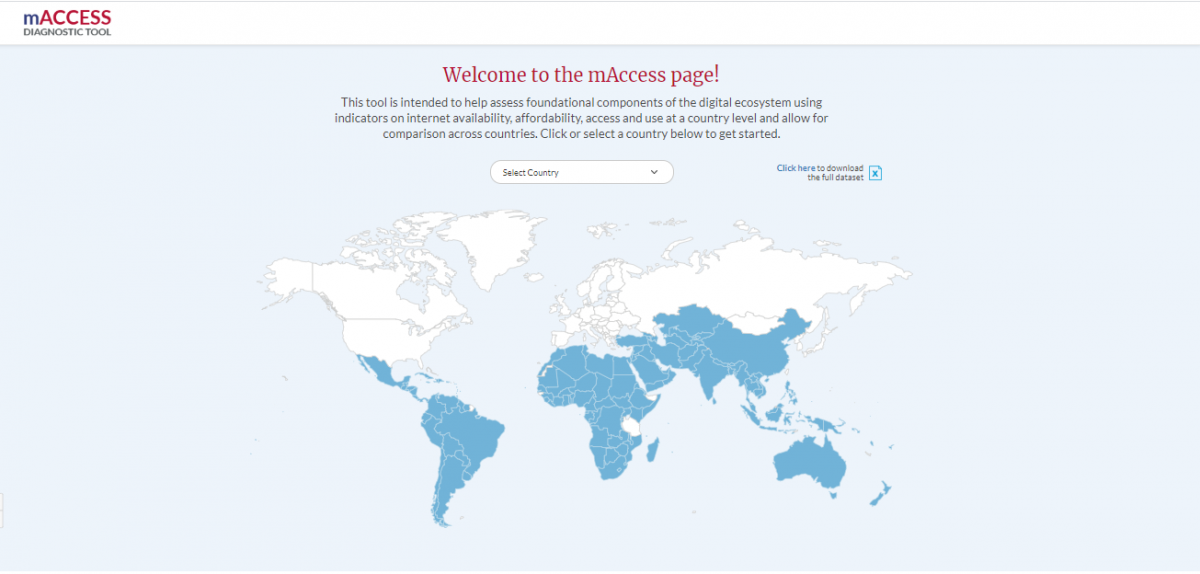
Data as a product has evolved significantly, both in terms of quantity and how it is designed, presented, and disseminated. The consumption of data-driven content and stories is on the rise worldwide, across various platforms. However, the usefulness of data hinges greatly on how well it is presented. Effective data visualization facilitates accessing information and supports monitoring, evaluation, advocacy initiatives, and statistical data presentation. Maintaining industry leadership, enhancing website content quality, and fostering data-driven collaborations and team analytics is crucial. Adopting a Human-Centered Design (HCD) approach, ASSYST ensured the tool meets the needs of diverse stakeholders, from global policymakers to research.
ASSYST collaborated with DAI to redesign the mAccess Diagnostic Tool for the United States Agency for International Development (USAID) as part of the Digital Frontiers Program. This tool, housed within USAID’s Center for Digital Development , allows users to assess digital ecosystem facts at a country level and compare data across nations.
The objective was to enhance the tool’s usability and value within USAID, supporting program implementation globally. The redesigned solution provides a sustainable digital approach that is crucial for analyzing internet availability, connectivity costs, and user demographics across more than 100 countries.
ASSYST’s approach to data visualization centered on key principles:
- Objectivity and Simplicity: Choosing appropriate visualization models and offering responsive interfaces for accessing country-specific data.
- Effective Communication: Prioritizing essential indicators and utilizing icons and charts to present information clearly.
The Right Chart for the Right Data: Ensure visualizations are aligned with the data being presented, effectively using axes and scales for comparative analysis.
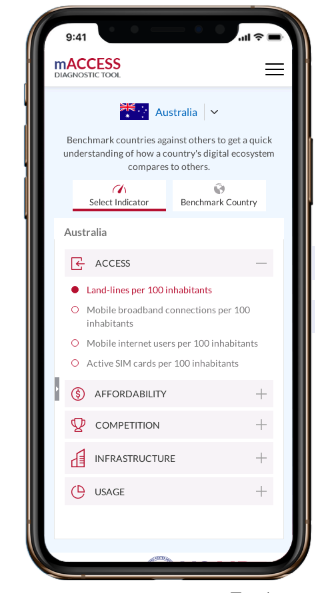
The design process was inherently user-centric, focusing on intuitive navigation and mobile accessibility. By minimizing clicks and optimizing content flow, ASSYST ensured the platform’s ease of use across devices. Accessibility testing and interactive prototypes further refined the user experience.
The revitalized mAccess tool now features a user-friendly landing page and inner pages adhering to USAID’s digital standards. It provides detailed country snapshots, allows users to select specific indicators, and facilitates benchmarking against other countries. This enhanced capability empowers governments and stakeholders to identify digital ecosystem challenges quickly, enabling better planning and decision-making.
The mAccess data visualization tool supports USAID’s development objectives and enables robust quantitative and qualitative analysis. The tool contributes significantly to refining development strategies and achieving sustainable outcomes by improving digital programs and measuring their impact.
Follow this link to explore the tool - http://maccess.digitaldevelopment.org/